Usage
Starting with importing relevant packages:
In [1]: import interpol as ip
   ...: from matplotlib.colors import to_rgba
   ...: import numpy as np
   ...:
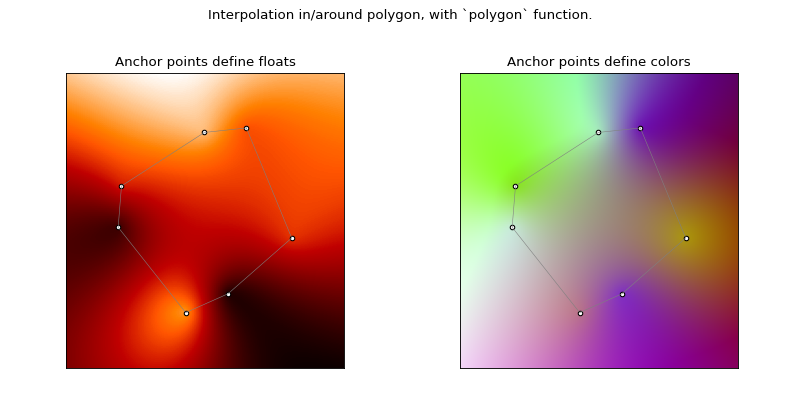
Single polygon
The function polygon interpolates values in the 2D-plane, when the values at the
nodes of a closed polygon are provided. The algorithm for this is described in
this great paper: https://www.inf.usi.ch/hormann/papers/Hormann.2006.MVC.pdf
Sample use:
In [2]: anchors = [[0,0], [1,0], [1,1], [0,1]]  # in order of appearance in polygon

In [3]: # Interpolation with numeric values.
   ...: values = [1, 5, 0, 2]
   ...: f = ip.polygon(anchors, values)  # get the interpolation function
   ...: f((0.5, 0.6))
   ...:
Out[3]: 1.7999999999999998

In [4]: # Interpolation with colors.
   ...: values = [to_rgba('w'), to_rgba('r'), to_rgba('g'), to_rgba('c')]
   ...: f = ip.polygon(anchors, values)
   ...: f((0.5, 0.6))
   ...:
Out[4]: array([0.4  , 0.575, 0.425, 1.   ])
Here is an illustration that shows how the interpolated values/colors vary across the plane for a given polygon. The anchor points are indicated.
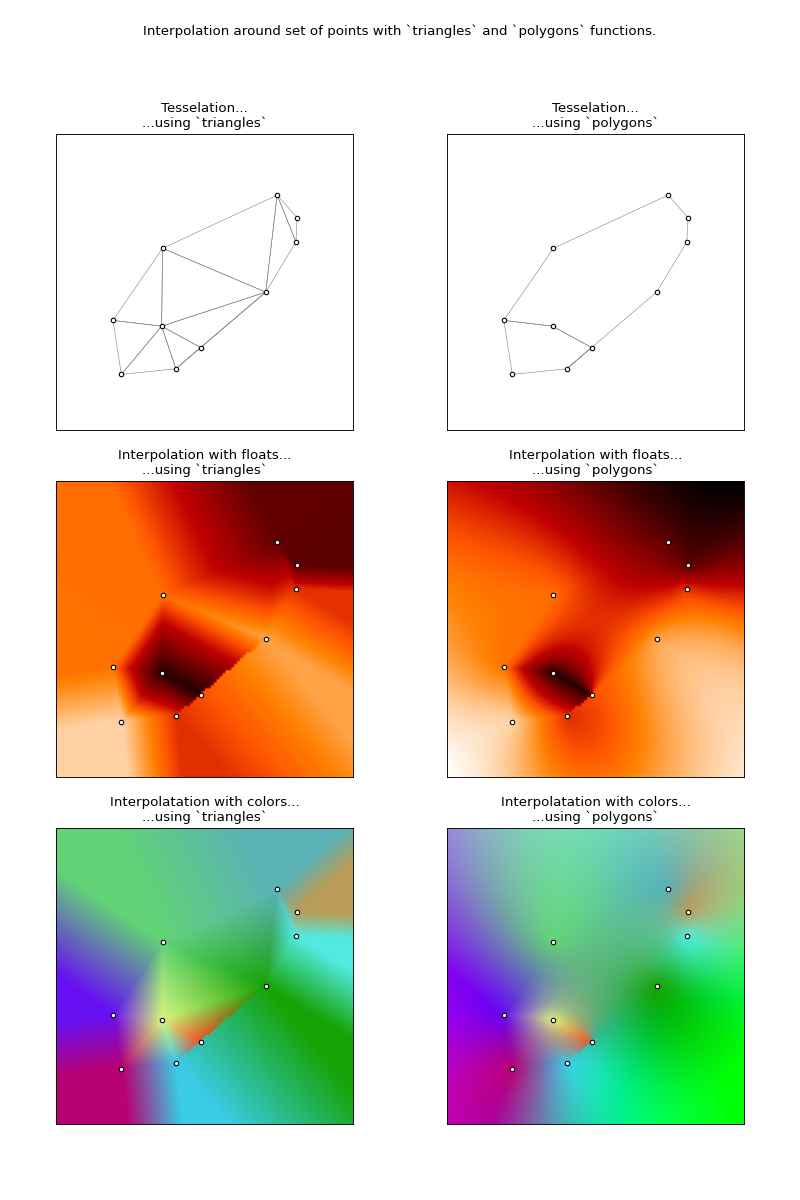
Set of points
There are 2 functions that interpolate values in the 2D-plane, when the values at several (unordered) points are provided.
trianglestessellates the plane with triangles (Delaunay tessellation) based on the provided anchorpoints, and does ‘standard’ barycentric interpolation within each triangle. Disadvantage: a maximum of 3 anchors is used for any point, which does not always look good. Also, extrapolation, i.e. to points that do not lay within the convex hull around the anchorpoints, is not possible. If wanted, the function tries nonetheless, but results are often poor.polygonsis a more general function, that gives better results. It divides the plane into polygons (using the “polygonation” developed in this project: https://github.com/rwijtvliet/polygonation) and does interpolation inside each of them using thepolygonfunction above.
Though it’s not perfect, polygons generally gives much smoother results, as
can be seen in the illustration further below.
Sample use:
In [5]: # Interpolation with numeric values.

In [6]: # using triangles

In [7]: # using polygons

In [8]: # Interpolation with colors: analogously.
Here an illustration that shows how the interpolated values/colors vary across
the plane. It also shows how both functions tessellate the plane on the first row.
Note how the second interpolation on each row (using polygons), is smoother
than the first (using triangles).